Bell Block Submission to Fire and Emergency New Zealand Taranaki Local Advisory Committee
- adrian75739
- 22 minutes ago
- 9 min read
To: Sam Bennett, Chair, Taranaki Local Advisory Committee
From: Adrian Sole, Chairperson, Puketapu-Bell Block Community Board
Subject: Submission in support of a daytime Yellow Watch and Type 3 appliance based in Bell Block
Dear Mr Bennett and members of the Taranaki Local Advisory Committee,
I write as Chairperson of the Puketapu-Bell Block Community Board to formally support the establishment of a daytime Yellow Watch based in Bell Block, operating five days a week with one daytime shift, together with a Type 3 fire appliance. This watch would be additional to the shifts already in place at the New Plymouth Fire Station (though some shuffling of staff may be appropriate to not have the New Plymouth station overmanned).
This submission is made in the interests of community safety, emergency readiness, and future-focused service planning for Bell Block and the surrounding growth corridor. Bell Block is no longer a small peripheral settlement. It is a fast-growing residential, commercial, and industrial community whose emergency service needs have increased materially, while local fire response infrastructure has not kept pace.
The role of the Local Advisory Committee is to provide Fire and Emergency New Zealand with advice from a local perspective on community values, needs, opportunities, issues, and risks. In that context, we submit that Bell Block now presents a clear and compelling case for a locally based daytime response capability.
Bell Block’s growth, combined with increasing traffic movements, expanding commercial activity, industrial development, and a wider range of emergency incident types, means that reliance on existing response arrangements is becoming increasingly strained. The supporting material prepared by Carey Duggan, Senior Firefighter at New Plymouth Station and local union representative, sets out that Bell Block has experienced major population and development growth, while New Plymouth’s operational demand has risen significantly. That material also argues that response performance is strongly affected by station location and distance from incidents.
The central issue is simple: distance matters in emergencies. Whether the incident is a structure fire, motor vehicle crash, hazardous substances event, or medical first response, faster attendance improves outcomes. The supporting maps provided with this submission (see Map 1 and Map 1a below) visually reinforce that Bell Block sits within a coastal growth and incident corridor, and that response performance across the wider New Plymouth–Bell Block area is shaped by geography, travel time, and where appliances are based.
A Bell Block-based Yellow Watch would be a practical and proportionate operational step. It would not be an extravagant request, but a targeted daytime deployment designed to strengthen first response where demand and risk are growing. A crew operating one daytime shift, five days a week, with a Type 3 appliance, would improve local resilience, reduce travel time to incidents in Bell Block and nearby areas e.g. Waitara and Inglewood, and provide valuable surge capacity to support the wider New Plymouth response area.
This proposal is especially compelling because it is an incremental solution. It does not require the immediate creation of a full 24/7 station model. Instead, it offers Fire and Emergency a staged, operationally sensible response to evident growth and risk. A daytime crew would place capability closer to where people live, work, travel, and build. It would also better align emergency resources with the changing profile of incidents being attended across the district.
The maps supplied in support of this submission suggest several points relevant to Bell Block. Map 1 shows the first response area boundary and associated five-minute drivetime coverage across the Bell Block/New Plymouth coastal fringe, highlighting how response geography is tied to where appliances start from. Map 1a further illustrates the current New Plymouth First Response Area boundary, clearly showing that Bell Block falls outside this primary response zone. Map 2 is a risk-index map showing concentrations of higher-risk groups across parts of the same urban coastal strip. Maps 3, 3a and 3b are response-performance maps distinguishing incidents where arrivals were within or outside the target across the wider New Plymouth–Bell Block–Waitara corridor, with the concentration of red (outside target) markers in and around Bell Block being particularly notable. Taken together, these materials support the case that Bell Block is both a growing demand area and a place where proximity of response matters.
Our Board has prepared an indicative levy contribution analysis covering Bell Block homes, commercial premises, and the wider Industrial Zone (set out in the sections below), and we continue to seek fuller levy information for lifestyle blocks and farms. The indicative analysis already demonstrates that this community contributes substantially to the fire and emergency funding base and should reasonably expect service planning that reflects its scale, growth, and risk profile. Together with the evidence on growth, geography, and operational demand, and the supporting maps and material attached to this submission, the case for improved local capability is clear.
Accordingly, the Puketapu-Bell Block Community Board respectfully asks the Taranaki Local Advisory Committee to recognise Bell Block as a priority area for strengthened daytime operational fire response capability; recommend that Fire and Emergency New Zealand assess and progress the establishment of a Bell Block-based Yellow Watch, operating five days per week during daytime hours; support the allocation of a Type 3 appliance to that crew; and ensure Bell Block’s population growth, commercial expansion, transport corridor pressures, and emerging levy data are factored into future service and infrastructure planning.
This is a reasonable, community-led, risk-based request. It is about matching emergency capability to a community that has changed substantially and continues to grow. Most importantly, it is about ensuring that when emergencies happen in Bell Block, help is closer, faster, and better positioned to protect lives and property.
Fire & Emergency Levy Contribution — Indicative Calculation for Bell Block
To further contextualise the substantial contribution the Bell Block community makes to the national emergency response funding base, we have prepared an indicative calculation of the annual Fire and Emergency New Zealand (FENZ) levies generated within our area. This methodology applies the current published FENZ levy rates to the estimated number and value of residential, commercial, and industrial properties in Bell Block.
Property Category | Number of Properties | Assumed Sum Insured |
Levy Rate | Levy per Property | Total Annual Levy |
Residential Buildings |
3,000 |
$650,000 | 11.95c per $100 (Capped at $119.50) |
$119.50 |
$358,500.00 |
Residential Contents |
3,000 |
$75,000 | 11.95c per $100 (Capped at $23.90) |
$23.90 |
$71,700.00 |
Commercial Properties (e.g., Parklands & Bell Block Court) |
30 |
$1,500,000 |
11.95c per $100 (No cap) |
$1,792.50 |
$53,775.00 |
Commercial Properties (Industrial Zone) |
351 |
$2,500,000 | 11.95c per $100 (No cap) |
$2,987.50 |
$1,048,612.50 |
PROPERTY LEVY SUBTOTAL | $1,532,587.50 | ||||
Motor Vehicle Levy — Indicative Calculation
In addition to the property-based levy, FENZ collects a flat motor vehicle levy on insured vehicles (currently $9.53 per vehicle per year for vehicles under 3.5 tonnes, effective 1 July 2024 to 30 June 2026). Assuming an average of 2 insured vehicles per residential dwelling and 2 insured vehicles per commercial/industrial property, the indicative annual vehicle levy contribution from Bell Block is calculated below.
Category | Number of Properties | Vehicles per Property | Total Vehicles |
Levy Rate | Total Annual Levy |
Residential Vehicles |
3,000 |
2 |
6,000 | $9.53 per vehicle |
$57,180.00 |
Commercial Vehicles (Parklands & Bell Block Court) |
30 |
2 |
60 |
$9.53 per vehicle |
$571.80 |
Commercial Vehicles (Industrial Zone) |
351 |
2 |
702 | $9.53 per vehicle |
$6,690.06 |
VEHICLE LEVY SUBTOTAL | $64,441.86 | ||||
Combined FENZ Levy Contribution
Levy Component | Total Annual Contribution |
Property Levy Subtotal | $1,532,587.50 |
Motor Vehicle Levy Subtotal | $64,441.86 |
GRAND TOTAL (Combined Property + Vehicle) | $1,597,029.36 |
Indicative total annual FENZ levy contribution from Bell Block (property + vehicle): approximately $1.60 million per annum
These are indicative figures based on publicly available levy rates and reasonable property and vehicle assumptions. Actual contributions may vary depending on individual sum insured values, vehicle ownership rates, and specific policy arrangements. However, this scale of contribution—approaching $1.6 million annually from Bell Block alone—strongly reinforces the case that this community deserves proportionate local fire response capability that reflects its size, economic output, and financial contribution to the FENZ network.
Notes and sources:
FENZ levy rate source: fireandemergency.nz/about-us/about-the-levy/levy-rate/ (Rates effective from 1 July 2024 to 30 June 2026).
Bell Block median house price source: realestate.co.nz market insights (Median sale price $708,500, supporting an assumed rebuild/sum insured value of $650,000).
Property counts as advised by the NPDC team.
Motor vehicle levy rate of $9.53 per vehicle per year (vehicles under 3.5 tonnes) per FENZ published rates, effective 1 July 2024 to 30 June 2026.
Vehicle assumptions: 2 insured vehicles per residential dwelling and 2 per commercial/industrial property. Actual numbers will vary; figures are indicative only.
Note: that the levy structure is changing from 1 July 2026 (including a new non-residential rate of 7.76c per $100 sum insured, and the motor vehicle levy increasing to $25.00 per vehicle per year), which would alter future contribution figures.
10 Year Forecast Projected FENZ Levy Contribution from Bell Block
Bell Block is on a clear growth trajectory. To illustrate the future scale of this community’s contribution to the Fire and Emergency funding base, the table below projects annual FENZ levy contributions over the next ten years using the following growth assumptions:
Residential properties: a further 900 dwellings added over the next 10 years, applied at a constant rate of 90 new dwellings per year (linear growth).
Commercial Properties (Industrial Zone): a linear increase of 5 new properties per year, applied to the current base of 351 ratable units (rising to 401 by Year 10).
Commercial Properties (Parklands & Bell Block Court) held constant at 30 properties (no growth assumed). Levy rates and per-property values held constant at current FENZ rates for ease of comparison.
Year |
Residential Dwellings |
Commercial (Parklands) |
Commercial (Industrial) |
Property Levy |
Vehicle Levy | Combined Total Annual Levy |
Current | 3,000 | 30 | 351 | $1,532,587 | $64,441 | $1,597,029 |
Year 1 | 3,090 | 30 | 356 | $1,560,431 | $66,348 | $1,626,779 |
Year 2 | 3,180 | 30 | 361 | $1,588,274 | $68,254 | $1,656,528 |
Year 3 | 3,270 | 30 | 366 | $1,616,118 | $70,160 | $1,686,278 |
Year 4 | 3,360 | 30 | 371 | $1,643,961 | $72,067 | $1,716,028 |
Year 5 | 3,450 | 30 | 376 | $1,671,805 | $73,973 | $1,745,778 |
Year 6 | 3,540 | 30 | 381 | $1,699,648 | $75,879 | $1,775,528 |
Year 7 | 3,630 | 30 | 386 | $1,727,492 | $77,785 | $1,805,277 |
Year 8 | 3,720 | 30 | 391 | $1,755,335 | $79,692. | $1,835,027 |
Year 9 | 3,810 | 30 | 396 | $1,783,179 | $81,598 | $1,864,777 |
Year 10 |
3,900 |
30 |
401 |
$1,811,022 |
$83,504 |
$1,894,527 |
Vehicle levy assumes 2 vehicles per residential dwelling and 2 vehicles per commercial/industrial property, at the current FENZ rate of $9.53 per vehicle per year. Vehicle counts grow in line with property counts.
Projected total annual FENZ levy contribution from Bell Block by Year 10: approximately $1.89 million per annum (combined property + vehicle)
Over the ten-year horizon, the combined annual FENZ levy contribution from Bell Block grows from approximately $1.60 million today to approximately $1.89 million by Year 10 — an increase of approximately $297,000 per annum (around 19%). This sustained growth in community contribution underscores the case for investing in proportionate local emergency response capability now, ahead of the demand and risk profile that this growth will bring. Establishing a daytime Yellow Watch in Bell Block is a sensible first step that will scale appropriately as the community continues to expand.
Supporting Maps
The following maps are referenced throughout this submission and are provided as supporting material. They illustrate the geographic, operational, and risk context underpinning the case for a Bell Block-based daytime Yellow Watch.
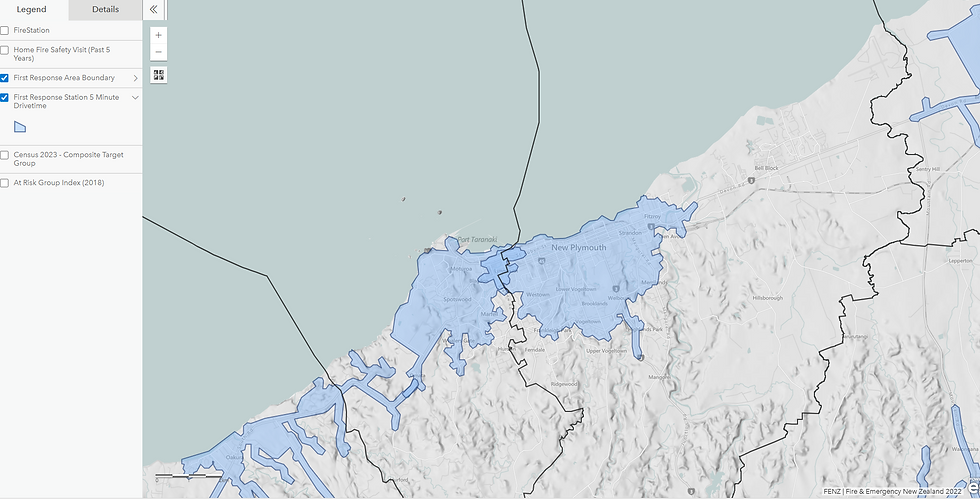
Map 1 — First Response Area & Five-Minute Drivetime Coverage (Bell Block / New Plymouth Coastal Fringe). Shows the current first response area boundary and associated five-minute drivetime coverage zone (shaded blue) across the New Plymouth / Bell Block coastal area. Highlights how response geography is tied to where appliances start from, and identifies coverage gaps that a Bell Block-based crew would address.

Map 1a — New Plymouth First Response Area Boundary (2361 New Plymouth). Detailed view of the New Plymouth First Response Area (shaded red/pink). Bell Block sits visibly outside this primary response zone, reinforcing the case that current arrangements do not reflect Bell Block’s growth, scale, and operational demand.

Map 2 — Risk Index Map (Higher-Risk Population Concentrations). Census 2023 composite at-risk group index across the wider New Plymouth and Bell Block region. The yellow-to-red choropleth identifies higher-risk population concentrations (red shading) within the same coastal urban strip where response improvements are sought. Demonstrates that areas of elevated community risk align with the Bell Block growth corridor.

Map 3 — Wider Response-Performance Map (Arrivals Within / Outside Target). Plots structure fire responses across the wider New Plymouth–Bell Block coastal area, distinguishing incidents where arrivals were within target (green) from those outside target (red). Reinforces the link between station location, travel distance, and response performance.

Map 3a — Structure Fire Response Performance (Bell Block focus). Closer view of structure fire response performance across the New Plymouth and Bell Block area, with first and second appliance arrivals categorised against target response times. The concentration of red (outside target) markers in and around Bell Block reinforces the case for a locally based daytime crew.

Map 3b — Wider Regional Response Performance (New Plymouth through Bell Block to Waitara). Broader regional view illustrating response-point distribution along the coastal corridor from New Plymouth through Bell Block and out toward Waitara. Highlights the extended geography that a Bell Block-based crew would help cover, including the nearby growth communities referenced in this submission.
Supporting material prepared by Carey Duggan, Senior Firefighter at New Plymouth Station and local union representative, is also referenced and provided alongside these maps.
Thank you for considering this submission. We would welcome the opportunity to speak to it in person and to provide further supporting information, as requested.
Yours sincerely,
Adrian Sole
Chairperson
Puketapu-Bell Block Community Board
Email: adrian.sole@npdc.govt.nz Mobile: 021 866338


Comments